Asteroseismology of M67: Seismic Characterisation Across Evolutionary Phases
Ensemble asteroseismology has revolutionized our ability to empirically link observed seismic properties to fundamental stellar parameters. Star clusters, with their uniform metallicity, distance, and age, provide an ideal environment for refining these relations.
In this study, we present the first asteroseismic analysis of M67 that spans its full evolutionary sequence, from subgiants to core helium-burning red giants, including a yellow straggler.
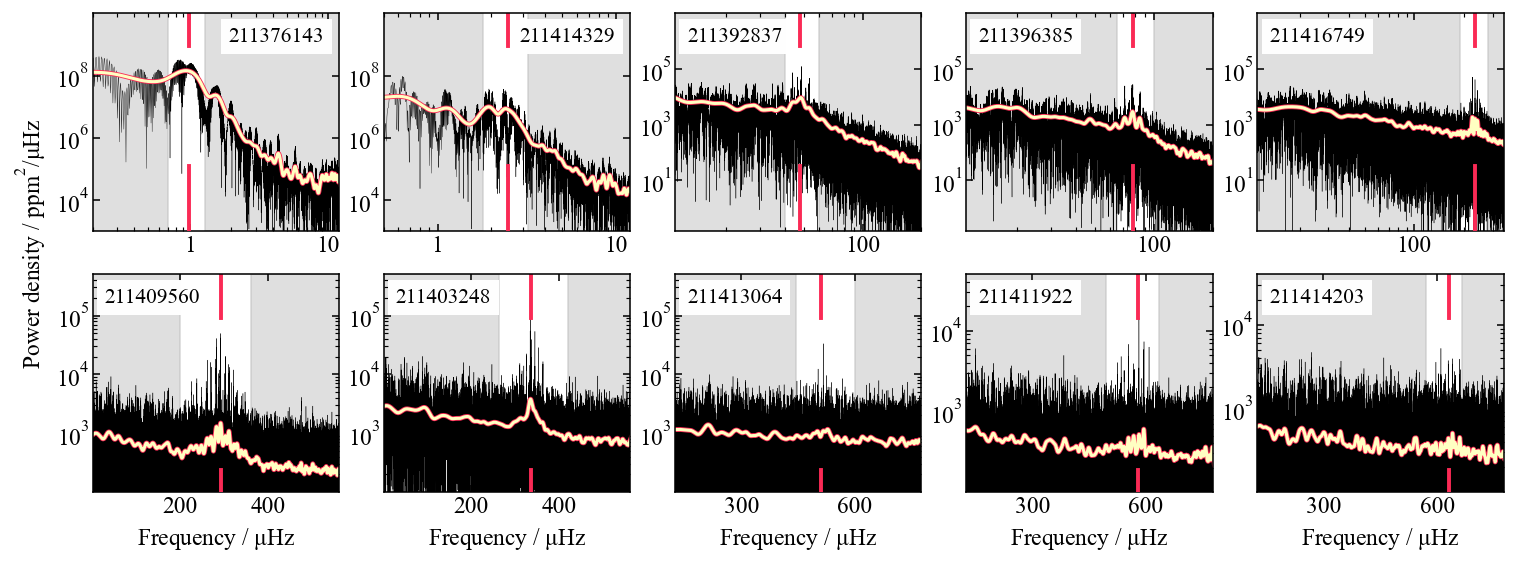
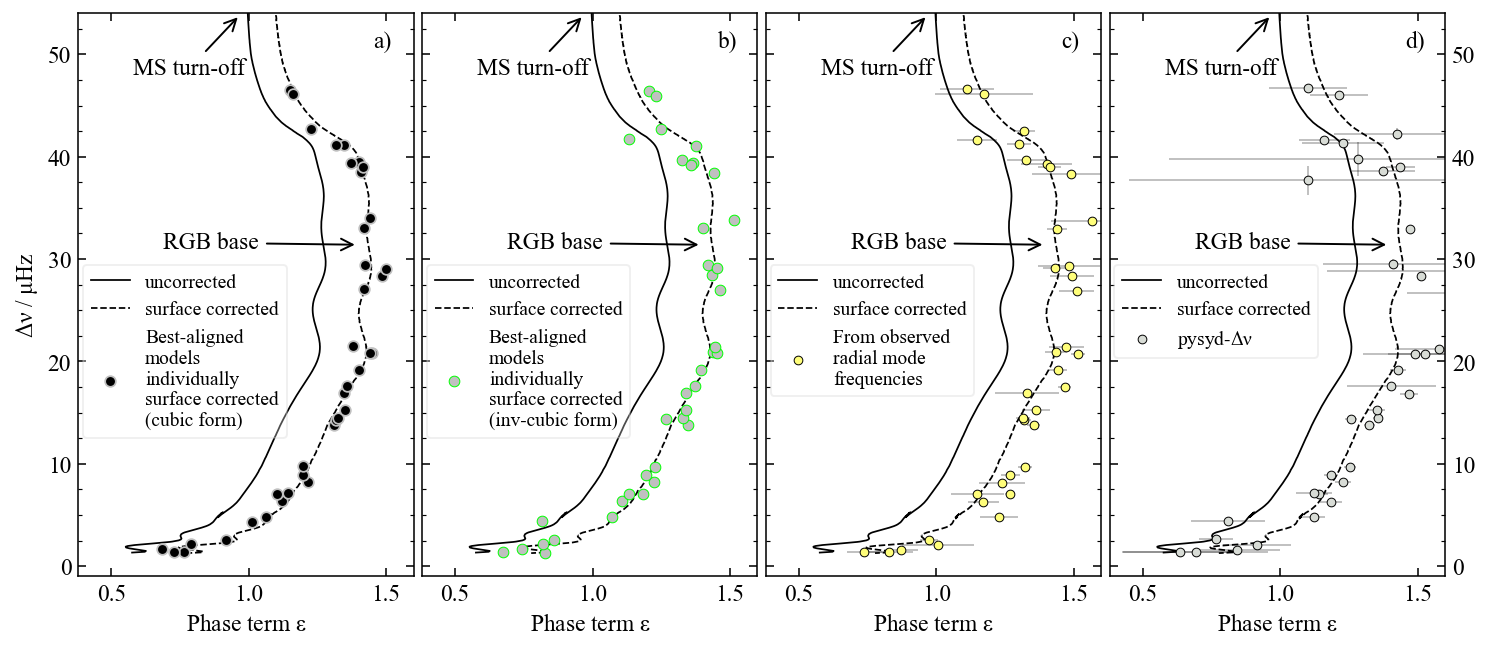
Using Kepler/K2 data, we measure seismic surface gravity, examine the potential role of core magnetic fields, and derive an empirical expression for the seismic surface term. We also extend the analysis of the asymptotic phase term ɛ to evolutionary stages previously unexplored in detail.
A key focus of our work was the calibration of seismic scaling relations for mass and radius. We quantified the systematic errors introduced when surface term corrections are omitted from state-of-the-art stellar models, demonstrating how significantly the scaling relations are affected by missing corrections. Our mass estimates indicated minimal mass-loss during the RGB.
Using isochrone models tailored to M67, we compared individual mode frequencies with theoretical predictions. We found that seismic masses for subgiants and red giant branch stars aligned well with isochrone expectation.

A traditional χ²-based seismic fit provides an estimated cluster age of 3.95 ± 0.35 Gyr.
📖 Read the full study here